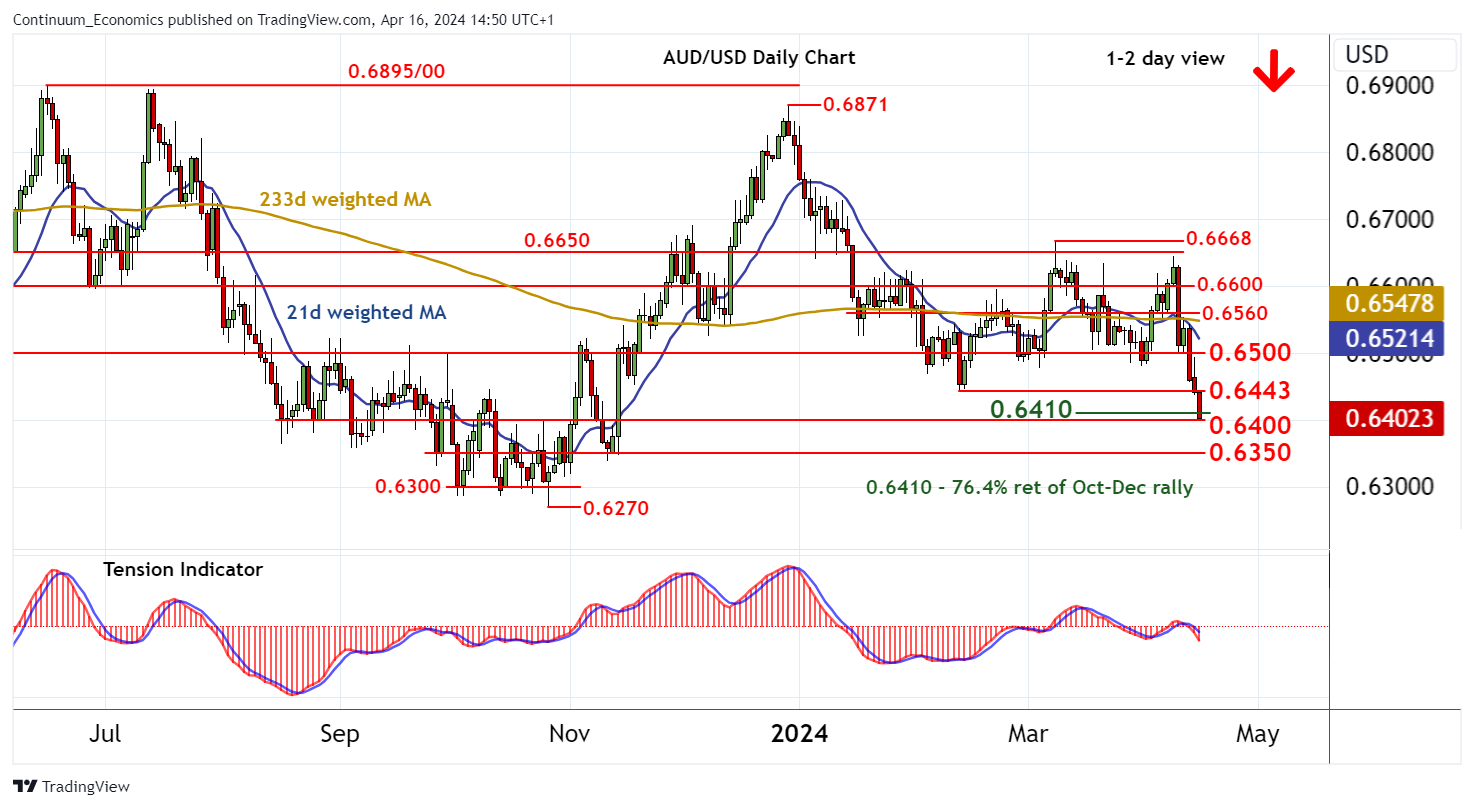
Chart AUD/USD Update: Fresh year lows at 0.6400/10 - studies remain under pressure

Anticipated losses have reached strong support at congestion around 0.6400 and the 0.6410 Fibonacci retracement
| Levels | Imp | Comment | Levels | Imp | Comment | |||
|---|---|---|---|---|---|---|---|---|
| R4 | 0.6600 | * | congestion | S1 | 0.6400/10 | ** | congestion; 76.4% ret of Oct-Dec rally | |
| R3 | 0.6560 | * | break level | S2 | 0.6350 | * | congestion | |
| R2 | 0.6500 | * | congestion | S3 | 0.6300 | * | congestion | |
| R1 | 0.6443 | ** | 13 Feb (m) low | S4 | 0.6270 | ** | 26 Oct 2023 (y) low | |
Asterisk denotes strength of level
14:30 BST - Anticipated losses have reached strong support at congestion around 0.6400 and the 0.6410 Fibonacci retracement. However, intraday studies continue to track lower and daily readings are negative, highlighting room for still further losses. A break will add fresh weight to sentiment and extend late-December losses towards congestion around 0.6350. However, flattening oversold weekly stochastics are expected to limit any break in short-covering/consolidation above congestion support at 0.6300. Meanwhile, a close back above the 0.6443 monthly low of 13 February will turn sentiment neutral and prompt consolidation beneath congestion around 0.6500.