Published: 2024-04-17T03:07:38.000Z
Chart USD/IDR Updates: Extending gains

Technical Analyst
-
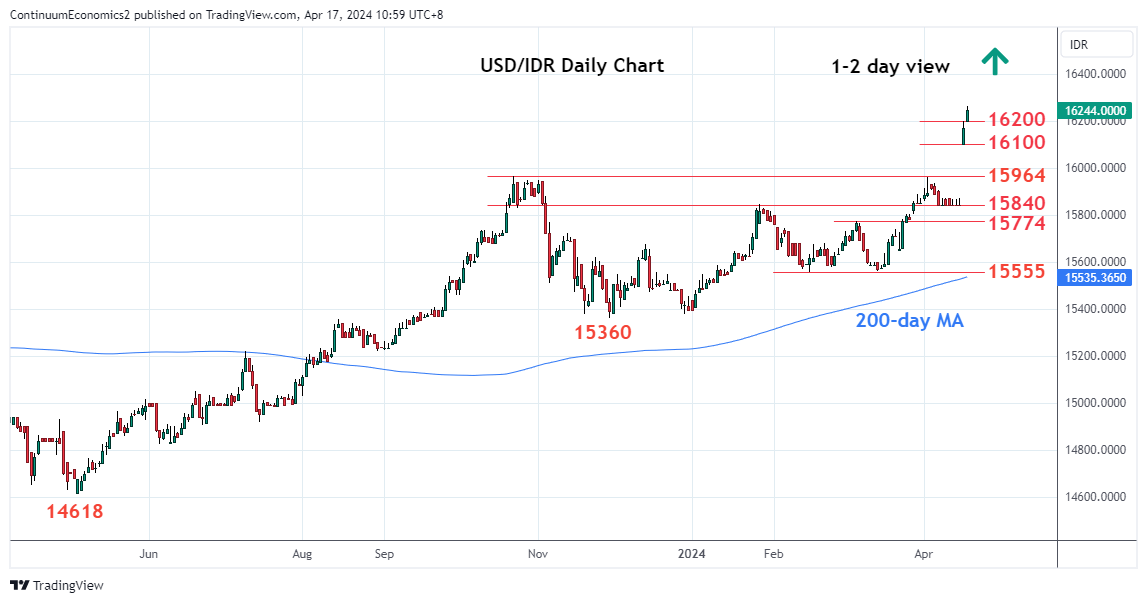
Pressure remains on the upside and break above the 16200 level further extend sharp break of the 2023 year high
| Levels | Imp | Comment | Levels | Imp | Comment | |||
|---|---|---|---|---|---|---|---|---|
| R4 | 16625 | ** | 23 Mar 2020 year high | S1 | 16200 | figure | ||
| R3 | 16565 | * | 6 Apr 2020 high | S2 | 16100 | * | 16 Apr low | |
| R2 | 16400 | * | congestion | S3 | 16000 | * | figure | |
| R1 | 16264 | * | intraday high | S4 | 15964 | ** | 23 Oct 2023 year high |
Asterisk denotes strength of level
03:05 GMT - Pressure remains on the upside and break above the 16200 level further extend sharp break of the 2023 year high at 15965 to reach fresh high at 16264. Higher still will see room to the 16400 congestion area from April 2020. Gains beyond this, if seen, will shift focus to 16625, the March 2020 multi-year high. However, the deep overbought daily studies caution corrective pullback. Meanwhile, support is now raised to the 16100 level and below here needed to open up room for deeper pullback to the 16000 level then the strong support at the 15964/15840 area.